Yesterday’s gratitude post let you guys in on the gem that is Rachel Cargle. Anybody already checked out a link or her instagram? Anyone else doing a bit of work?
I have. I’ve been researching the public school system in our area and holy hell, graphs are worth a thousand words. Buckle up.

This post will focus on the statistics for Black and White students in our district.
Some highlights:
- There are 23,144 students preschool-12th grade in the district.
- 22.1% are Black.
- 46.4% are White.
Now come the pretty pie charts. First, let’s look at who gains access to gifted and talented resources.
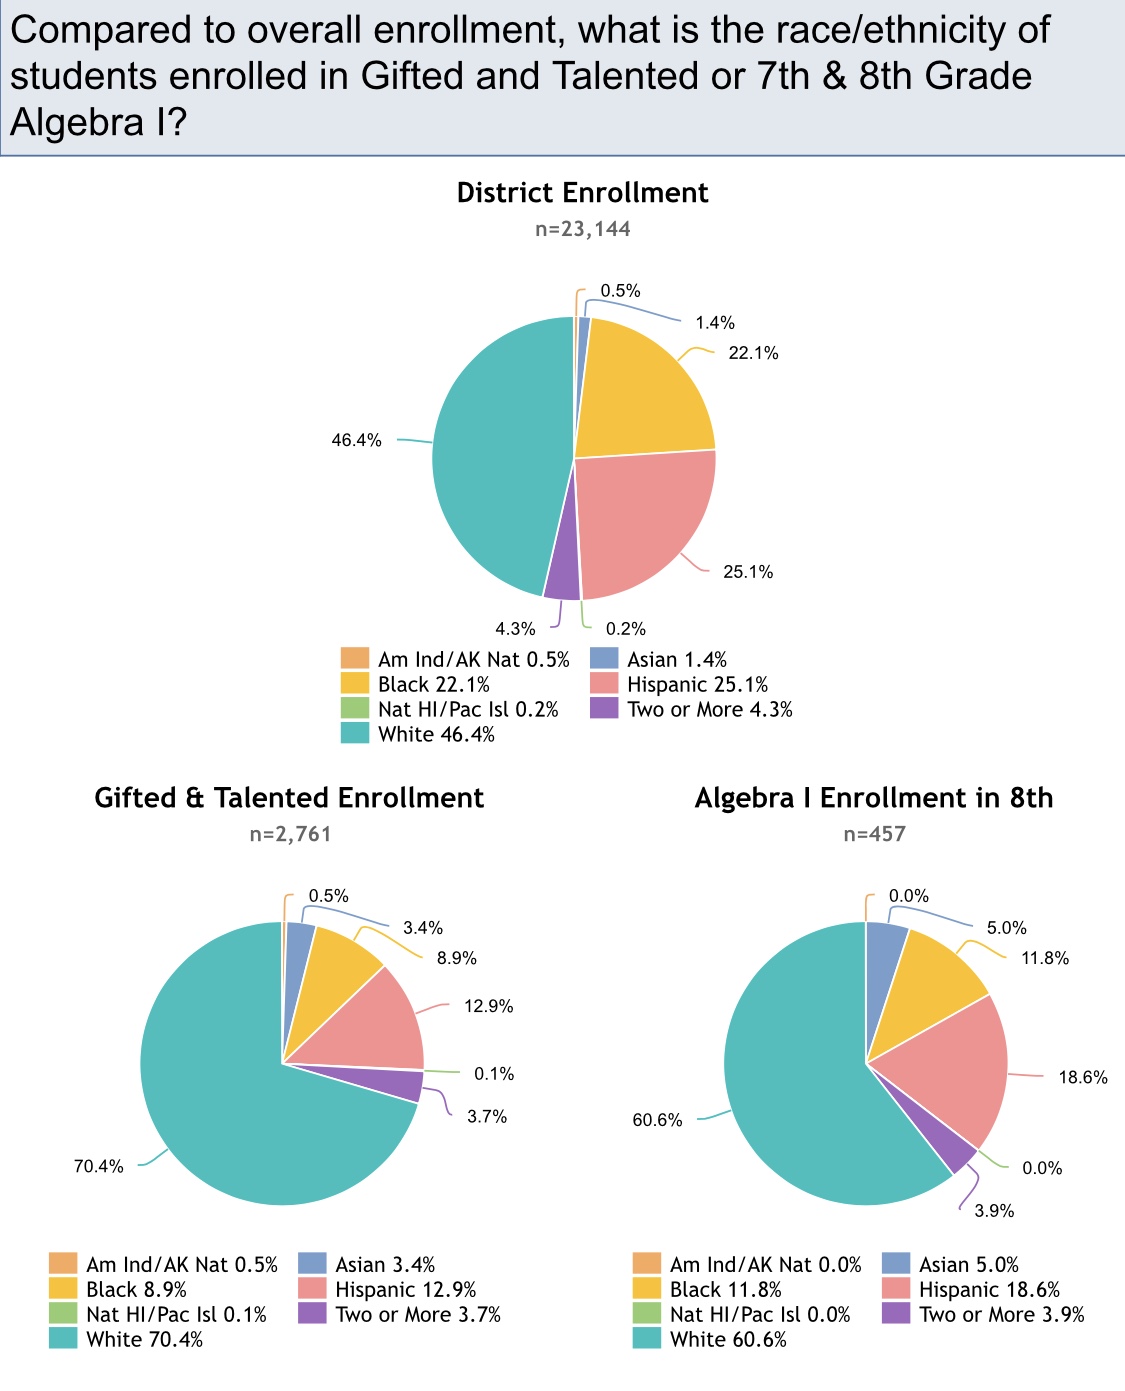
Some highlights from the Gifted & Talented Enrollment statistics:
- There are 2,761 students districtwide identified as gifted.
- Whites make up 46.4% of the district but 70.4% of students identified as gifted.
- Blacks make up 22.1% of the district but only 8.9% of students identified as gifted.
Let’s break those numbers down further¹:
- 2,761 gifted students
- 1,944 are White
- 246 are Black
And a little further still:
- 18 out of 100 White students are identified as gifted.
- Less than 5 out of 100 Black students are identified as gifted.
Look at those stats. Are we really willing to believe whites make up less than half the student population but almost three fourths of the gifted population?
Is your head spinning yet? Hold on, here comes the doozy.

Let’s break it down by category.
In-School Suspension (1,267 students):
- Whites make up 41.4% of students assigned ISS.
-
- At 525 students that’s 5 out of 100 White students suspended.
- Blacks make up 36.2% of students assigned ISS.
-
- At 459 students that’s 9 out of 100 Black students suspended. Black students were almost twice as likely to receive ISS.
Out-of-School Suspension (1,672 students):
- Whites make up 33.6% of students assigned OSS.
-
- That’s 562 White students in OSS. That’s 5 out of every 100 White students suspended.
- Blacks make up 40.8% of students assigned OSS.
-
- That’s 682 Black students in OSS or 13 out of 100 Black students suspended. Black students were 260% more likely to receive OSS.
Explusions:
- 100% Black.
-
- 100.effing.percent
Still with me? That’s a lot of data to digest. Tomorrow we’re gonna talk about what we can learn from the numbers.
You can find the Department of Education’s link in “Here’s How to Find Out How Racist Your Kid’s School Is.”
You should check out your district, too.
¹ Traditional rounding rules were used for all decimals in this post.

I teach this in my Diverse Populations class, so I’m glad to see how you’ve broken this down so easily. A lot of people don’t realize that institutionalized racism is an entirely different ballgame. It’s not as blatant as hanging someone from a tree. It’s more insidious.
LikeLiked by 1 person
It’s like quicksand – the deeper you dive, the faster you sink. That’s why I started writing the small bites series. Institutionalized racism is all interwoven so pulling on one thread starts unraveling 4 more. It’s overwhelming.
LikeLiked by 1 person
Excellent work, Laura! I wonder about the definition of gifted and talented, which I guess means what kinds of classes/resources are available. My guess is that it’s pretty narrowly defined. I’m also wondering if you’re going to share this in a letter to the editor or something.
LikeLiked by 1 person
Thanks, JoAnna. In our county you qualify for gifted with scores above a certain percentile in aptitude/achievement testing. Then you receive services from a teacher certified in gifted instruction – pullout classes up to 5 times a week – the amount depends on your scores. Does that make sense? Right now I’m working on getting with the school board but you make an interesting suggestion…
LikeLiked by 1 person
So “gifted and talented” is based only on scores from standardized tests? That would show a student is good at taking standardized tests. What about things like musical or artistic talent? I know I’m preaching to the choir here, but gifted and talented do not seem accurate words. Good luck and best wishes. ❤
LikeLiked by 1 person
Yes! ⬆️ This!!!
LikeLiked by 1 person
When I saw your post on IG I was immediately intrigued and curious as to whether I could get this information for my kids’ school and I am SO glad you shared this story and links.
I must say, our school charts are better than your school charts. For one, we have a much greater diversity, with the highest population being students who identify as black. It is still clearly racist when you look at the gifted and talented. That’s a concern. I often think that’s more to do with economics than race, but that’s because of institutionalized racism as well, so no matter how you look at it, it’s evidence of racism.
On a personal note, of the brilliant students I am regularly exposed to, most of them are kids of color. Like, the pride n’ joy kids, always getting awards? Moo, her friend who looks white (is blonde, no kidding) but is mixed, and has a Hispanic last name… Did I mention diversity here? Anyway, those two and another white as Moo kid, always with the same group, all of whom are children of color, more children of color than the white chickies, and Moo is the whitest one, heritage-wise. Now I’m thinking about the economics and can say most of them are from our blue collar hood, and a few are from the affluent sections, so economics isn’t the factor there, it really could be merit-based in that group… the rumor is that class is overall exceptional academically.
When they announce the top ten percent, it’s mostly black kids and mixed kids, so you would think this would be reflected in the stats… but um, no. Back to that gifted and talented enrollment and also SATs (which because your background is mine, you know that ish is racist and classist af) and that’s lopsided from the stats. Really, almost as bad as your sample.
Two peculiar things about my kids’ school — One, white kids are in trouble and absent the most, and fewer than four *that’s what it says* kids were expelled, but the ones who were? were black. Erm…
Also, black kids take chemistry THE MOST — at a completely disproportionate percentage — ie: there are 54.9% black students, and chemistry is taken by 51.9%, like black students are REALLY INTO CHEMISTRY? and white kids are like, “Nah, I’m good.” heh.
Again, I thank you for sharing this. I am glad you’re bringing these things up, Laura. You stir a fine pot of truth.
We’re not doing a good enough job.
LikeLiked by 1 person
You have done a fine job looking through your own district’s stats, friend.
Gotta admit, that chemistry one threw me. I’ll be chewing on that for a while…
I keep getting jammed up on the logic of it. Numbers aside — if your top 10% are primarily kids of color, how is the gifted program trending white? If white kids rank highest for discipline and absenteeism, HOW IS THE GIFTED PROGRAM TRENDING WHITE? Also, yes, quite coincidental that the (relatively) few(er) black kids in trouble include the only four (3.7?) who were expelled.
My thinking cap is tired tonight. Thanks for adding your thoughts, Joey. I enjoy seeing a bigger cross sampling of districts and hearing firsthand from parents who are seeing it themselves.
LikeLiked by 1 person
That gifted thing really gets me.
LikeLiked by 1 person
The statistic that caught my attention is that almost 9% (8.9) of the white students (far more than any other group) are chronically absent. That appears to be 8.9%, not 8.9% of 46.4%, but the numbers add up to the total that’s listed, so it’s hard to know.
If it represents a percentage of the students, the rate for whites is close but slightly higher, proportionately than the Hispanic and Black rate. If it’s a percent of the percent, it’s alarming (but the total would indicate that it’s not).
I focus on that because, I would think it’s unlikely that gifted students are chronically absent, and I think it would be hard for a chronically absent student to thrive in a gifted and talented program. Because the percentages are close, it doesn’t affect the amounts much, but it further concentrates the results, which are scary without the concentration.
When I was on our school system’s Parent Advisory Committee, chronic absenteeism was one of the things we addressed. There were actually parents that complained that changes we made to the attendance policy, adversely effected their child’s class rank. We also eliminated talented and gifted (TAG) programs, until better ways of identifying kids could be worked out and until the assignment of teachers to those programs didn’t take away from the opportunities of non-TAG students. If that sounds enlightened, it wasn’t, it was a ploy to get more money in the budget (because parents want their kids in TAG classes).
You’re doing a good thing, paying attention to and trying to understand these numbers. My guess is that you’re paying more attention than the people who compile them.
LikeLiked by 1 person
I hope that’s not the case, but my hope is tempered these days. I have a friend who’s making sure our school board sees this.
I’m so glad to hear that chronic absentee stat caught your eye, too! It bothered me and I crunched those numbers but couldn’t find a way to suss out the implications without adding another 300 words to this thing. 🙄 The relative measures, to me, seem off. If whites make up a (much) greater percentage of gifted students then logic dictates their absenteeism rate should be lower overall.
I love that your committee addressed chronic absenteeism at all, and eliminating TAG until you found better ways to identify and serve (not just TAG but ALL) students was genius.
LikeLiked by 1 person
It was a mix of genius and greed, but I think it did work. I was off the committee within a year or two after that.
LikeLiked by 1 person
Neat article! Pretty interesting… Do you happen to know what the district takes into consideration for one to be labeled as “gifted” and placed in honors and gifted classes? Do they take district and state test scores, grades, and GPA into account, or do students go through an application process to be reviewed to see if they meet “gifted” requirements?
LikeLiked by 1 person
Thanks, Emily. It’s an application process. They need to be referred by a teacher then qualify with scores on a standardized test.
LikeLiked by 1 person
Students can also qualify for enrichment based on End Of Grade tests and universal screeners as well as parent and teacher referrals. Also all 3rd grade students take the Cogat test to identify any students who would qualify for additional testing. It is not based solely on teacher recommendations. While they do play a part in the initial testing outs wide of grade 3. At least for elementary school.
LikeLiked by 1 person
Ugh! These stats look so familiar. I hate it.
Research about “School-to-Prison Pipeline”. It’s crazy.
LikeLiked by 1 person
I haven’t done a lot of work on that one but you can bet I’ll pull it now.
These graphs. I’m a visual girl and when I hit an ALL YELLOW ONE my brain almost exploded. Still in the wtf stage, I think.
Thanks for reading!
LikeLiked by 1 person
I clicked “like” because there is no “I love it that you dragged this into the light” button.
LikeLiked by 1 person
Thank you. This is a hard post to comment on but I think yours just nailed it. 💛
LikeLiked by 1 person
Your kids are fortunate you’re looking into this with such detail. I’m thankful my kids are out of the school systems!
LikeLiked by 1 person
I’m late to the game, frankly, because I’m white and didn’t have to think about it. But when you see the percentages shift around like that…well, it’s hard NOT to see the truth, you know? Thanks for reading, Shelley.
LikeLike